The digital backbone for wildlife monitoring across wind, solar & grid.
Digitize fatality monitoring, shutdown-on-demand, and pre-construction surveys. Then prove compliance and mitigation impact across every site you own.
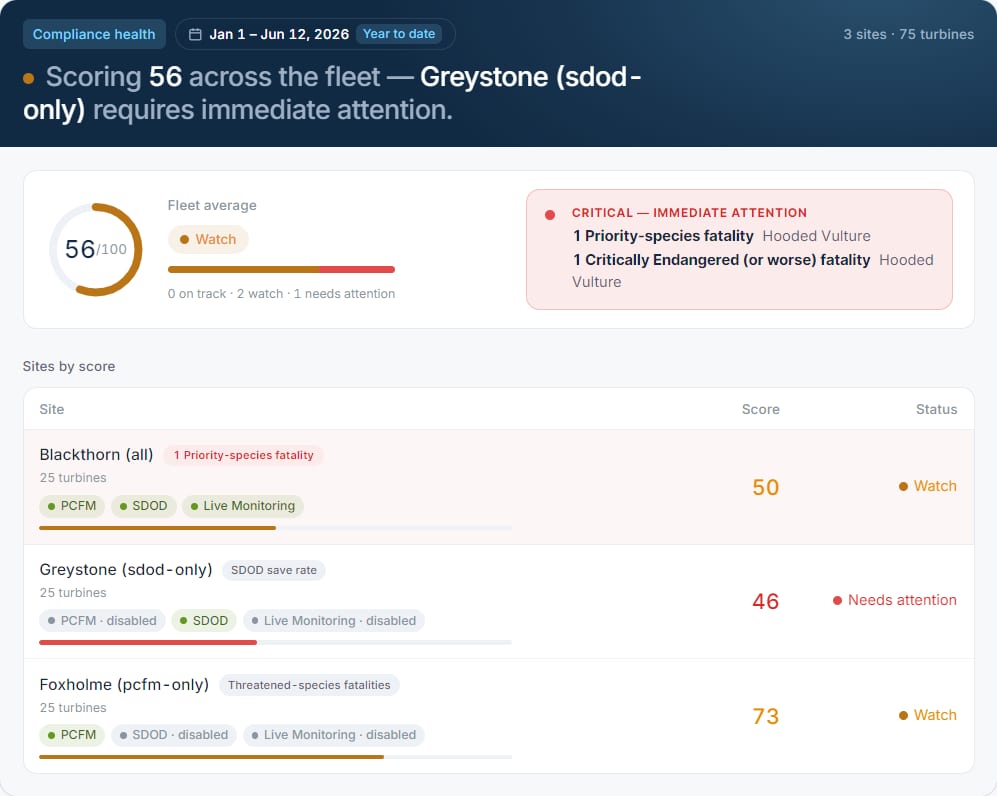
Know where every site stands. Prove it to anyone.
Each site's data is trapped with a different contractor, in a different format. Ask which sites are compliant, or whether a mitigation paid off, and the honest answer is nobody knows. SafeTurbines makes every site speak the same language: scored, compared, and ready to defend.
Your IFC score, before the lender asks.
The IFC guidance is dense and your data is scattered, so most teams never get a straight answer. SafeTurbines grades each site automatically: every requirement assessed, weak spots flagged, and every gap cited to the exact clause.
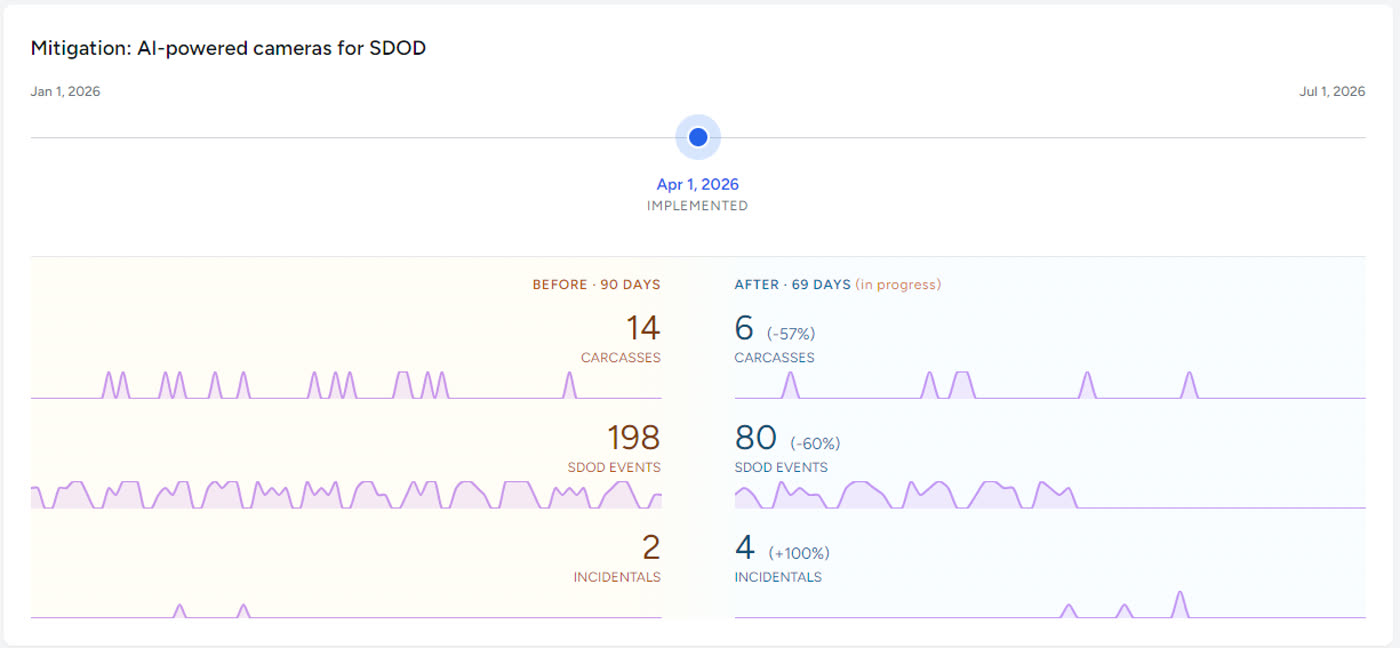
You bought the AI cameras. Did they work?
Nobody can say. The proof is buried in vendor reports no one has ever pulled together. SafeTurbines brings them into one place and measures fatalities before and after each mitigation, per site and across your whole portfolio, apples to apples.
So how does your organization get here?
One step: digitize your monitoring programs. SafeTurbines hands your teams the complete toolset, and everything above follows. Teams with monitoring protocols already in place go live in days or weeks, not the months enterprise software usually takes.
In the field
One backbone
All data shares the same language.
Apples to apples
IFC compliance scores
All sites
One toolset, from the field to the boardroom.
SafeTurbines digitizes your monitoring programs: post-construction fatality monitoring (PCFM), shutdown-on-demand, and pre-construction. Then it turns the data into the views your teams and execs act on.
Capture everything, even offline.
One offline-ready app for all three programs. Capture in the field, then sync the moment you're back in range. No signal required.
-
Carcass searches & bias trials (PCFM): GPS-tracked routes and photo evidence auto-linked to every carcass, plus searcher-efficiency and carcass-persistence trials, on schedule.
-
Shutdown-on-demand (SDOD): every shutdown logged on the spot, feeding straight into your site and portfolio insights.
-
Pre-construction live monitoring: draw flight paths right on the device. No paper, no transcription.
Live monitoring · VP-2
New sighting
FP-09142-7K4QX
Egyptian Vulture
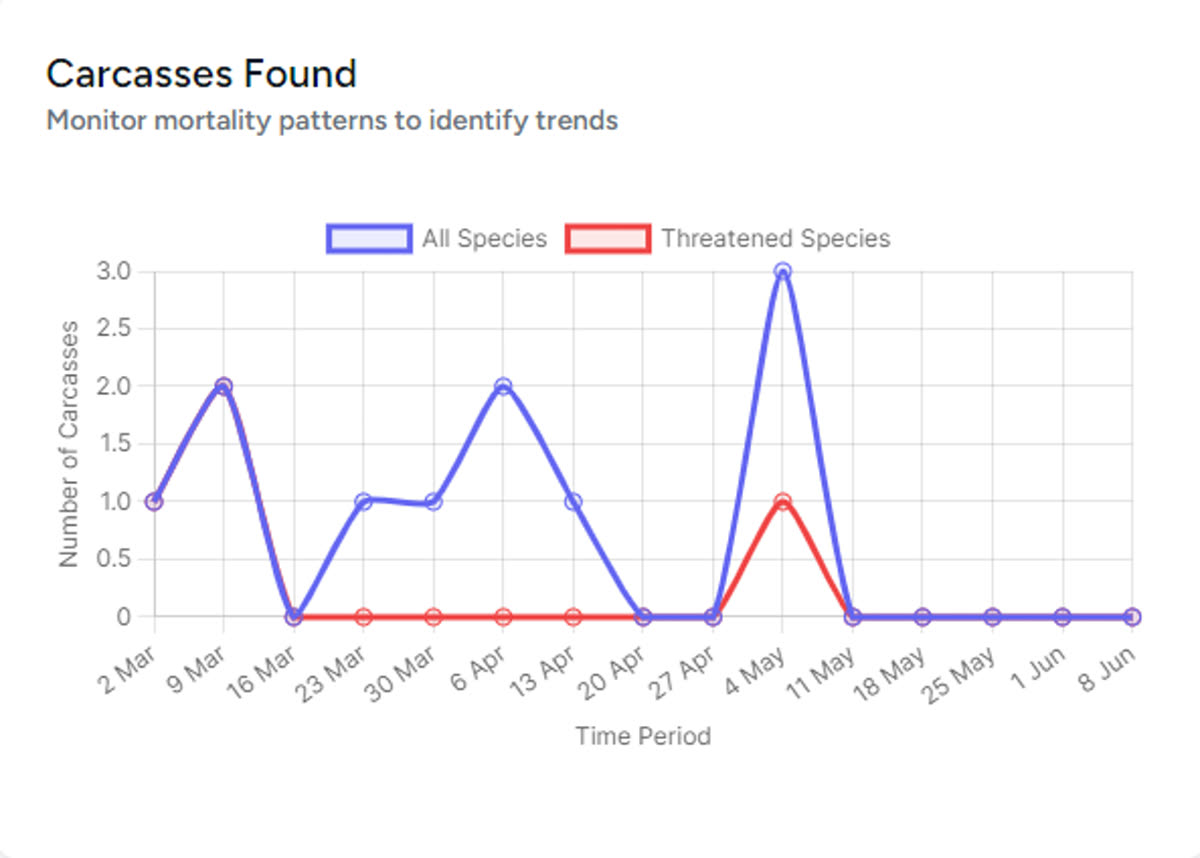
Catch mortality spikes early.
Mortality trends over time, all species charted against threatened ones. A spike shows up as it happens, not in the year-end report.
GenEst-ready in one click.
Every carcass, trial, and search session is assembled into the complete GenEst input bundle at export time. We handle the wrangling. You get files ready for analysis.
GenEst input bundle
One click → all five GenEst input files, shaped and ready.
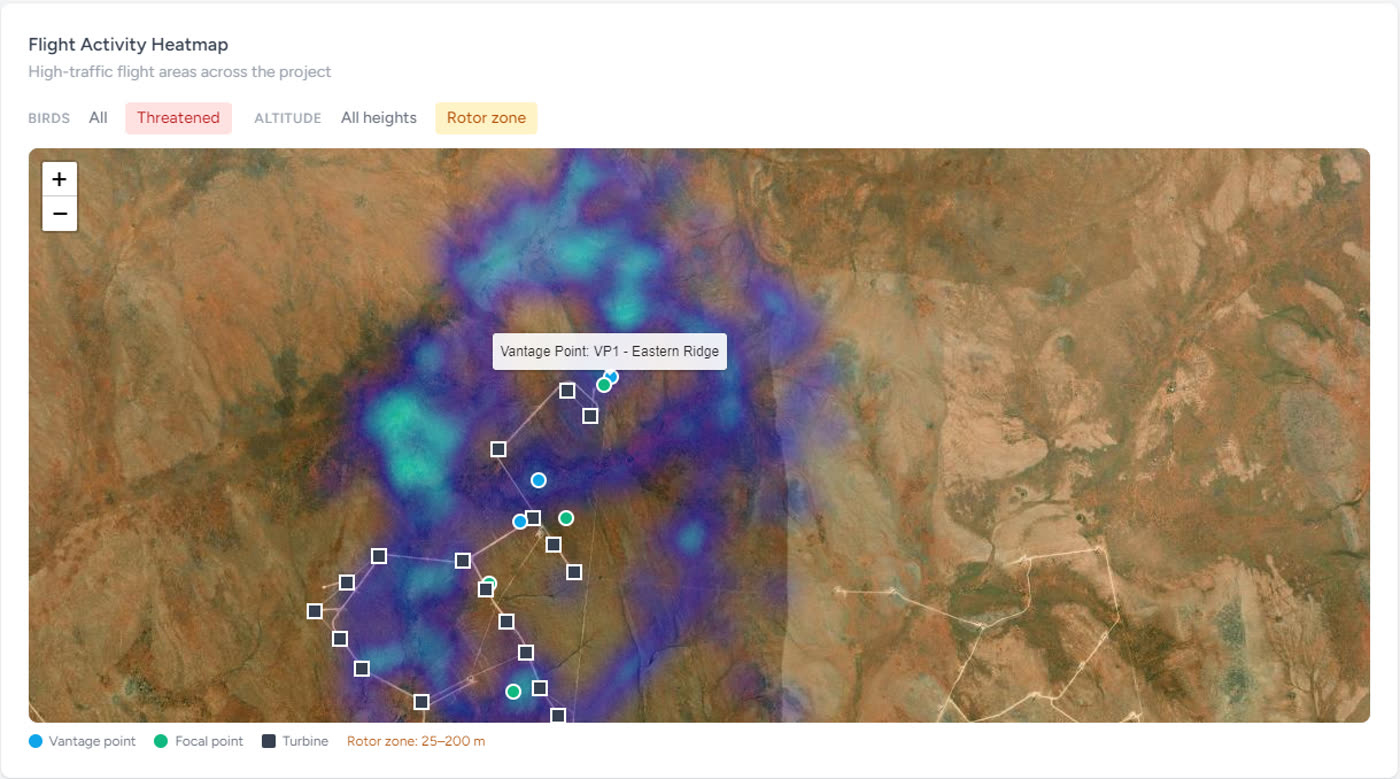
Put observers where the risk is.
Over any timeframe, a heatmap surfaces which turbines and areas drew the most sightings, so shutdown coverage and mitigation follow the activity, not guesswork.
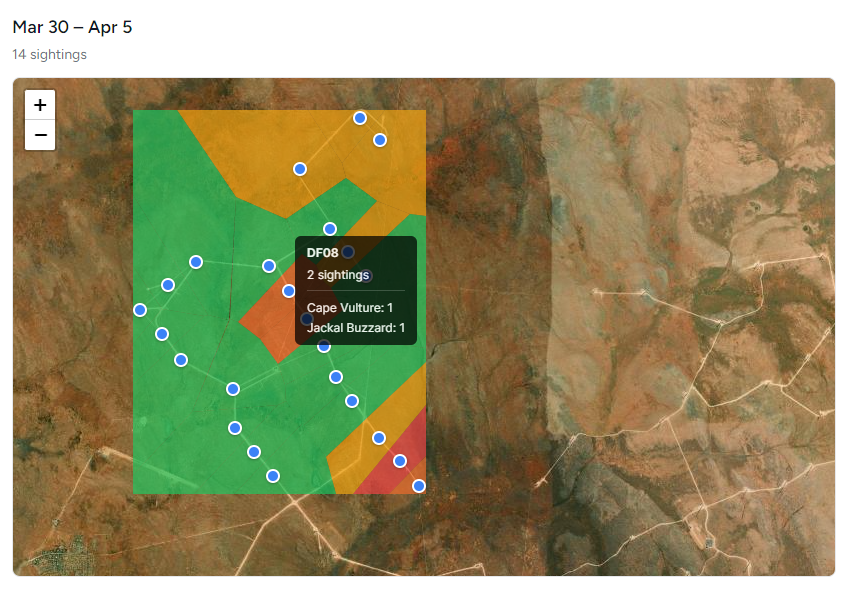
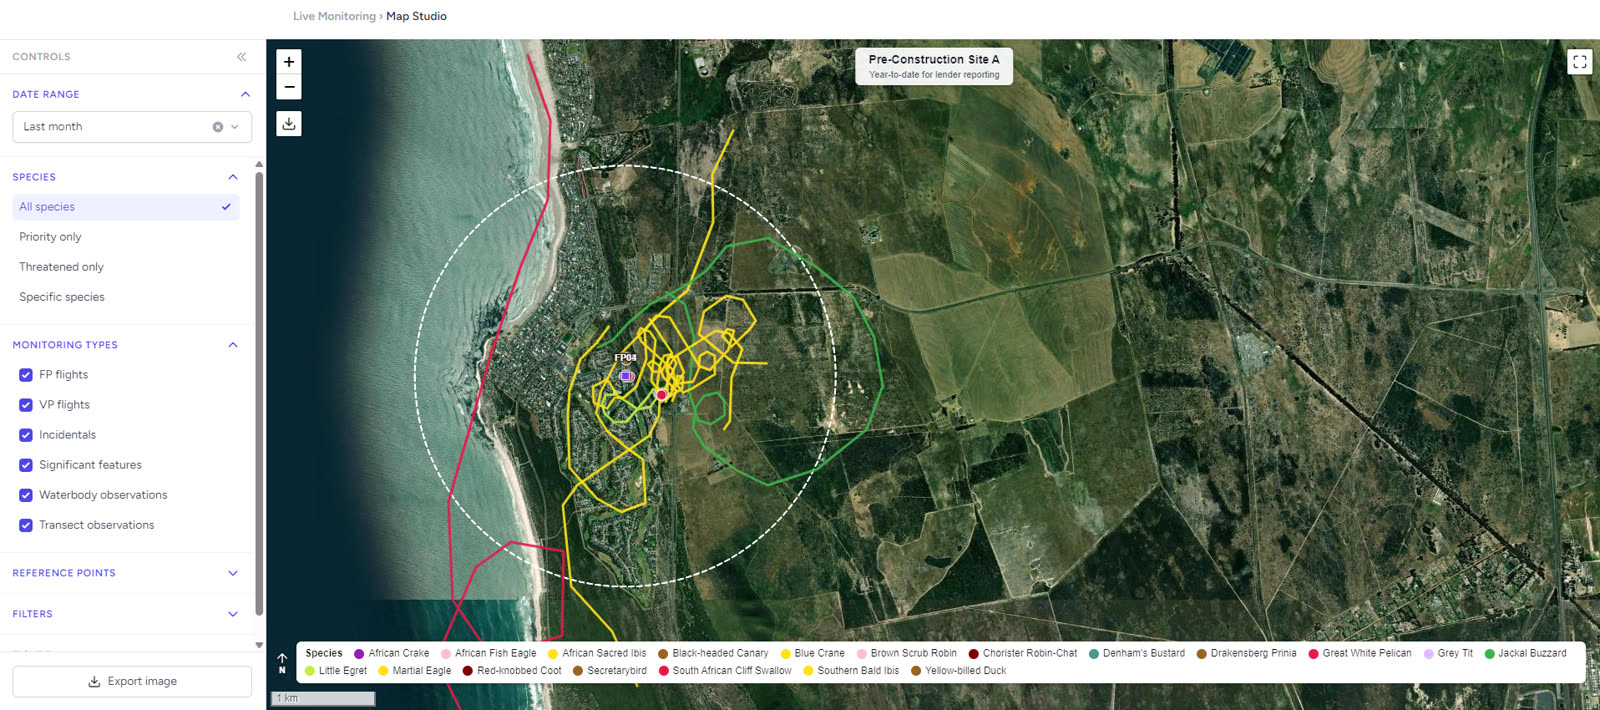
Every track and sighting, on one map.
Each sync adds to a single live picture of the site. Filter to any species or date range, then export the view as instant evidence for lenders and regulators.
The corridors that drive siting and curtailment.
A heatmap of exactly where birds spend the most time on site, built from your own observers' field data. The highest-risk corridors stand out at a glance.
 Turbines
  Overhead Lines
  Solar
Solar  Vendor APIs
  Weather Data
  Sensors
  Site Topology
  Your Source
  + More
 Every source, one backbone.
Field, environmental, and vendor sources all flow into one place, a single source of truth. That's the backbone: the reason every site speaks the same language and your whole portfolio compares at a glance.
Get in touch
Let's talk
Whether you're exploring options or ready to get started, we'd love to hear from you.
Message sent!
We'll get back to you soon.